


 Рейтинг: 4.0/5.0 (1873 проголосовавших)
Категория: Windows: Запись звука, голоса
Некоторым пользователям рано или поздно может понадобиться записать разговор в Skype. Как же это сделать?
Сразу стоит оговориться, средствами самой программы это сделать нельзя, но можно использовать сторонний софт. К слову, выбирать есть из чего. Остановимся на самых простых по интерфейсу.
Программа Call Graph
Эта простая и бесплатная программа записывает только аудиофайлы в формате .mp3. Запись начинается вместе со звонком (входящим/исходящим) и прекращается с его завершением.
Перед установкой Call Graph закройте Skype во избежание возможных конфликтов.
Установка программы очень простая, а при последующем запуске Skype она запросит соответствующее разрешение на запись. Вам необходимо будет подтвердить просьбу, после чего уже следующий звонок будет записываться.
Также вы можете протестировать запись разговора, позвонив в Sound Test Service.
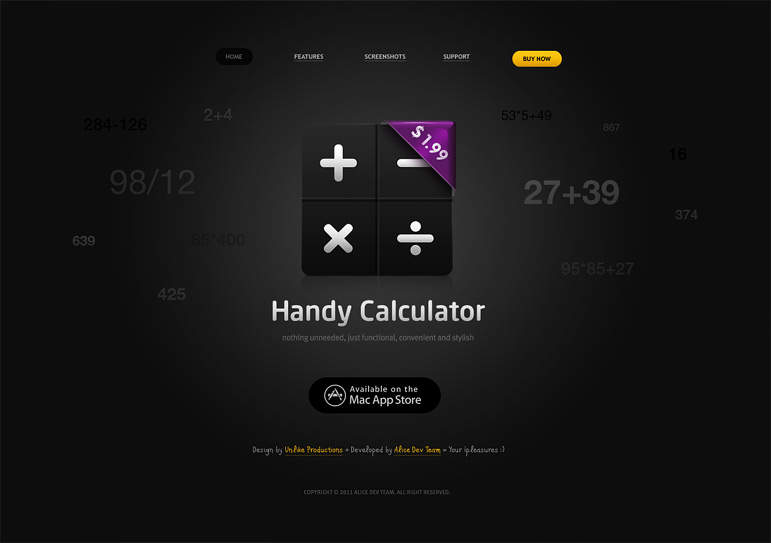
Управлять программой можно с помощью Toolbar.
Программа iFree Skype Recorder
И хотя эта программа имеет английский интерфейс, она легка в управлении. Принцип установки аналогичен Call Graph — сначала запускаем установщик, а затем установленную программу. Она отправит разрешение Skype на авторизацию. Необходимо подтвердить доступ.
Звонки в программе также записываются автоматически, а также ей можно управлять вот таким окошком.
Кнопки тут интуитивно понятные, поэтому каждый пользователь сможет разобраться без труда.
iFree Skype Recorder записывает разговор в формате .mp3. Настройки программы предусматривают настройку качества записи.
Программа MP3 Skype Recorder
Наверное, наиболее удобная для пользователей программа, поскольку имеет все необходимое для записи в окне управления.
Устанавливается точно так же, как предыдущие две программы.
Главное окно позволяет в пару кликов изменить разные настройки: качество записи, место сохранения, параметры запуска.
Нажав на красную кнопку  вы включаете автоматическую запись всех звонков.
Программа Video Call Recorder for Skype
А эта бесплатная программа умеет записывать и видеозвонки. Приятно и то, что программа имеет русский интерфейс.
Перед установкой необходимо закрыть Skype, в противном случае установка будет невозможна.
Во время установки вам будет предлагаться также установить дополнительное программное обеспечение. Будьте внимательны.
Главное окно программы очень простое по функционалу, собственно, в ней даже и разбираться не требуется. Но если есть какие-либо вопросы, то подробная инструкция о функционале главного окна есть на официальном сайте программы.
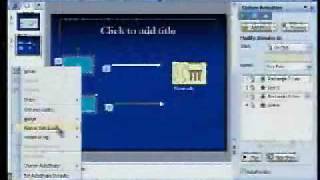
В отличие от остальных программ, эта работает в ручном режиме, но можно включить и автоматическую запись. Для этого в главном окне программы выберите Инструменты, параметр Опции. вкладка Video Input. Поставьте галочку, как показано на скриншоте.
Обратите внимание, что записывать программа может не только видеовызов, но и аудиовызов.


This simple and intuitive application lets you record, manage and organize all of your Skype conversations, saving them to MP3 or WAV format
Call Graph is a lightweight and user-friendly software solution aimed to offer you the means of recording your Skype conversations, allowing you to automatically or manually start the capture and letting you store the files to your computer.
Skype authorization processBear in mind that in order to work with this application, not only do you need to have Skype installed on your system, but you also need to authorize Call Graph on it. This can be done from the ‘Tools’ menu of the chat client, by selecting ‘Options’.
Next, in the ‘Advanced’ section, you will need to click on ‘Manage Other Program’s Access To Skype’, choosing ‘CallGraph.exe’ and pressing the ‘Change’ button, then saving the modification, thus enabling you to start using the recorder.
A non-intrusive system tray toolCall Graph runs automatically in the notification area, allowing you to access it by right clicking on its icon, but otherwise not interfering with your activities.
The corresponding ‘Toolbar’ window enables you to start, pause or stop recording Skype phone conversations, each change being displayed as a popup balloon from the system tray, informing you of the status modification; this however, can easily be disabled.
Record Skype phone calls and save them to audio formatFor starters, you first need to make the call you wish to capture, then select the ‘Start Recording’ option from the notification area menu, or click on the equivalent button in the ‘Call Graph Toolbar’. The same actions can be used to pause or completely stop a recording.
Call Graph allows you to configure the destination folder for all the captured files, begin able to choose between WAV and MP3 as target formats, the latter allowing you to select the ‘Channels’, ‘Sampling Rate’ and ‘Bit Rate’. Optionally, you can insert a timestamp into the name of the exported audio.
Basic Skype recorderTo sum it up, Call Graph is a handy and easy to use utility designed to assist you in capturing audio files of all your Skype phone calls, enabling you to save them to MP3 or WAV and listen to them later.
PyCharm allows running the current run/debug configuration while attaching a Python profiler to it.
If you have a yappi profiler installed on your interpreter, PyCharm starts the profiling session with it by default, otherwise it uses the standard cProfile profiler.
Note that profiler runs on both local and remote interpreters.
Starting the profiling sessionTo start the profiling session, do one of the following:
The profiler starts in the dedicate tab of the Run tool window :
Working with the profiling resultsOn the toolbar of the profiler tab, click  . This action results in the following:
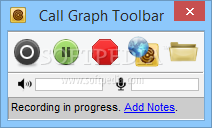
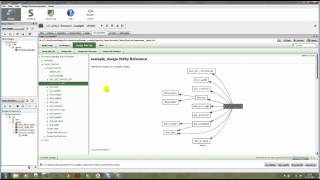
 The profiling results open in the <project name>.pstat tab in the editor, which consists of two tabs: Statistics and Call Graph.
To navigate to the source code of a certain function, right-click the corresponding entry on the Statistics tab, and choose Navigate to Source on the context menu:
The source code of the function in question opens in the editor.
Viewing Call GraphTo navigate to the call graph of a certain function, right-click the corresponding entry on the Statistics tab, and choose Show on Call Graph on the context menu.
The Call Graph tab opens with the function un question highlighted:
To increase the graph scale, click  ; to show actual size of the graph, click
  .
.
Use the toolbar button  to fit contents into the current diagram size.
To decrease the graph scale, use  .
.
Note the color codes on the Call Graph. The functions marked red consume more time; the fastest functions are green.
Reviewing the existing snapshot To open the existing snapshot, follow these steps:The profiling results open in the <project name>.pstat tab in the editor.
Бесплатно скачать Skype Recorder можно на этом сайте:
Данный софт предназначен для того, чтобы сохранять беседы и конференции. Skype Call Recorder настроена на запись как входящих, так и исходящих вызовов. Запись включается сама, вам даже не придется нажимать на какую-либо кнопку.
Приложение может сохранить даже два и более звонка одновременно. Причем они окажутся в разных файлах, а найти их можно будет очень легко и быстро. Торопитесь скачать Скайп Рекордер. эту незамысловатую и удобную программу. Даже если вы пока не собираетесь ею пользоваться, такая программа никогда не будет лишней. Free Skype Recorder. кстати, не требует настройки. После скачивания можно сразу же приступать к эксплуатации. Free Skype Call Recorder обязательно поможет вам сохранить наиболее важную информацию, которую нельзя забыть. Чаще всего пользователи записывают, конечно, рабочие разговоры.
Evaer Video Recorder for SkypeThe call graph shows the calling relationships between methods during the execution of your application, and is focused on a method of your choice (the chosen method; shown in black in the example below). If a given method is called in several contexts, it is shown once for each context in the call graph. The chosen method is shown only once in the call graph, unless it is called recursively.
Selecting a chosen method makes it easy for you to visualize all the callers and callees for that method.
The percentage value shown in each method is calculated with respect to the chosen method as follows:
Calculations in the call graph are always made with respect to the selected region of the timeline, or the whole profiling period if you have not selected a region.
For information on how async code is shown in the call graph, see Async in the call graph .
Creating a new call graphEvery instance of a call graph is based on a particular method. To create a call graph, first select a method in the call tree, methods grid, or source code, then click 
The call graph is displayed in the results pane.
Changing the call graph display optionsYou can change the way data is displayed in the call graph, using the display options on the results toolbar:

If you want to include blocking such as waiting for I/O, choose from Wall-clock time. If you don't want to include blocking, choose CPU time . The timing units dropdown menu alters the timing units.
You can choose whether to display time in Percentages , Ticks , Milliseconds. or Seconds .
Choosing Percentages displays the time the method took as a percentage of the period currently selected on the timeline.
When time is shown as a percentage, the time for each method shows the proportion of the total execution time that the method contributed during the selected period. The total percentage for all methods can sum to over 100 on machines using multiple CPU cores.
You can resize the call graph by rotating the mouse wheel, or by using the zoom controls to the left of the call graph. You can pan the call graph by dragging on a blank part of the graph.
To expand a method on the call graph (that is, to show the method's immediate children or parents), click the method.
To expand the most expensive path from a particular method, hold down Ctrl and click the method. Alternatively, right-click and select Expand most expensive stack trace .
To expand the most expensive path for all children from a particular method, hold down Shift and click the method. Alternatively, right-click and select Expand most expensive stack trace for all callees .
To expand the most expensive path for all parents of a particular method, hold down Shift and click the method. Alternatively, right-click and select Expand most expensive stack trace through all callers .
To collapse a method on the call graph, double-click the method.
More about call graphsMethods are drawn in several different styles in a call graph:
Call graphs always include methods for which no source code is available (for example, methods from the .NET Framework class library) and methods for all threads running in your application during profiling.
Ads by Google
Skype. as we know, is great for making calls, video conferencing and saving money on long distance telephone bills.
While Skype is a feature-rich tool, it doesn’t have the ability to record voice calls. But that doesn’t mean you can’t do it. There are third-party tools, add-ons and plenty of other methods to record a Skype conversation .
Today we’ll talk about one of the best free tools to record a Skype conversation. Known as CallGraph. it is a conversation recording plugin for Skype. You can use this tool to record calls of any duration.
The tool stores the recordings on your computer, so there are no privacy worries either.
Here are the instructions to authorize and use this plugin to record Skype calls.
Step 1. Before you use this plugin you need to connect it with Skype by authorizing it (CallGraph redirects audio data to and from Skype to record the call). You cannot record both the sides of call without authorization.
A warning will flash on the Skype dashboard “Another application (CallGraph.exe) is attempting to access Skype, but we are unable to respond. Please try to restart the application ”.
Step 2. Restart Skype. Now Go to Skype > Tools > Options
Step 3. On the left navigation bar click on ‘Advanced ’ tab. Click on the link “Manage other programs access to Skype ”.
Step 4. You will find Callgraph there. Click on change button. If you don’t see the application then you have to restart Skype and try again.
Ads by Google
Step 5. In the next step check the option “Allow this program to use Skype”. Click OK button.
Step 6. On the task bar, look at the Call Graph icon. If a green tick mark appears on it then it means the plugin is authorized and you can record any call now. If you don’t find it then you need to restart your PC.
Note: You can also record a conversation without green tick mark (sign of authorization) on the icon but it may not deliver accurate results.
Step 7. Click on the CallGraph icon. It will show the toolbar. While making a call on Skype, press the record button. The recording will start immediately. You can also stop recording at any time during your conversation.
Right click on the icon and select configuration option. You can check settings according to your preference. You may select automatically record Skype call option (you don’t need to press record button manually). On Recording tab you can select the format of recording (mp3 or wav), sampling rate and bit rate.
All the conversations are saved in your My Documents folder. You can also go to CallGraph browser by right clicking on the icon on toolbar and selecting “Browser ” option. You can modify files by clicking on “File action ” link. You could also add tags to the conversation so that you can search for any important file easily in the future. Rename and add notes to the conversation too.
After testing this plugin I found it to be very efficient. The sound quality is good and the recording was done smoothly without any errors.
Do you know of other ways to record Skype calls? Got any Skype tricks you’d like to share? The cooments section is open for you.
The call graph shows a statically calculated thread resolved call graph for selected nodes. The nodes are methods, classes, packages, or Java EE components, depending on the selected aggregation level.
To calculate a call graph, click  Generate graph in the tool bar or select View->Generate Graph from JProfiler's main menu. If a graph has been calculated, the context menu also provides access to this action.
Package names are shortened by default with only the last package name shown in full. For example, com.mycorp.myapp.mypackage becomes c.m.m.mypackage. You can disable package shortening in the view settings.
The percentage base is
 Show calling nodes
 Show called nodes
 Add nodes to graph, to add other unrelated nodes to the graph. The node selection dialog will then be displayed.
If applicable, an node has plus signs at the left and the right side to show or hide calling and called nodes. The controls at the left side are for calling, the controls at the right side for called nodes. The plus signs have the same effect as the Show calling nodes and the Show called nodes actions. Additionally, the plus signs give you the indication that there might be nodes to display and that you have not yet tried to expand them.
The first time the outgoing calls of a node are expanded, only calls above the threshold that is configured in the view settings are displayed. If there still are outgoing calls below below the threshold, a  shaded icon is shown on the right side. If you expand again, all outgoing calls are displayed.
You can hide nodes by selecting them and pressing the delete key. You can select multiple nodes and delete them together. Alternatively, you can select the  remove nodes from graph action from the graph toolbar or the context menu.
If you delete methods, the call graph may contain a number of unconnected branches. To clean up the graph, select a method on the branch that should be retained and select the  cleanup unconnected methods action from the graph toolbar or the context menu. The "remove all but selected nodes" action in the context method allows you to trim the graph to a few selected nodes.
Any modification to the call graph can be reverted with the  undo action. If you open a large number of calls and want to track back to a previous state of the graph, hit this button repeatedly. If you hit undo too may times, a redo action is also available. Consecutive undo/redo is useful for replaying what happens to the graph when expanding a node.
The call graph offers a number of navigation and zoom options.
Call Graph functionality is supported by MPLAB X. To view its functionality, go to the toolbar click on Window-> Output-> Call Graph.
An empty (Call Graph) window should appear below your code.
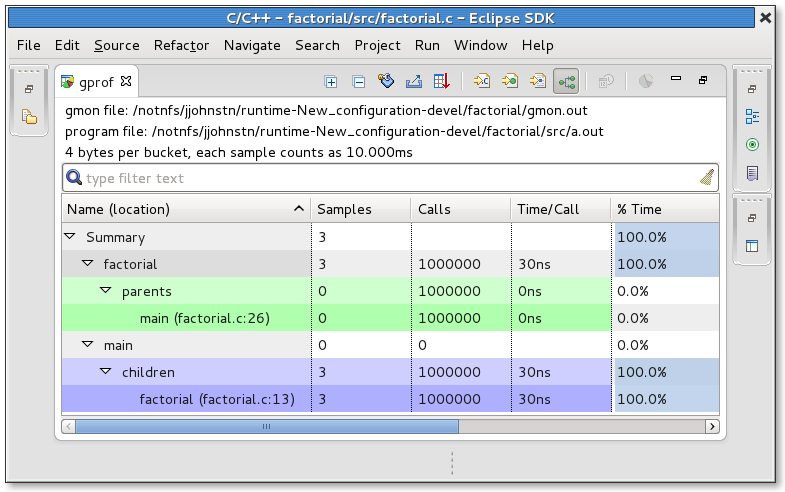
To populate the Call Graph window, we must first highlight a function in your code, do a right-click and select "Show Call Graph". At this point you should see the Call Graph Window populated with a graphical image showing the relationship between the selected Parent function and its Children functions.
The Call Graph in MPLAB X allows you to perform certain functionalities such as:
MPLAB X allows the user to view the declaration of the selected function using Call Graphs. The Call Graph window is divided into two sections. The left hand side of the call graph window shows a Collapsing/Expanding tree menu of the Parent and Children function. The right hand side of the Call Graph window shows a graphical representation of the Parent/Children functions. To view the declaration of the function, hover over the desired function, right click on it and select "Go to Declaration". MPLAB X will then open the .c file where the function was declared.
Figure 1.2-Function Declaration Viewing "The children of the parent function" (Expanding Callee)There are two ways to view what functions are being called from the selected function. These two methods are explained below:
Select a function whom you wish to know its children functions. Click on the (+) sign to expand the menu tree. A list of children functions should appear in the menu tree as well as in the Graphical representation of the call graph.
Viewing "The children of the parent function" using the graphical representationSelect a function whom you wish to know its children functions. Right click on the function and select "Expand Callee". A list of children functions should appear in the menu tree as well as in the Graphical representation of the call graph.
Viewing "The Parents of the child function" (Expanding Caller)In the graphical representation of the Call Graph, select a function whom you wish to know its parent function. Right click on the function and select "Expand Callers". A graphical representation of all the parents functions calling the selected function should appear in the Call Graph window.
Figure 1.4-Expand Caller Exporting the Call GraphMPLAB X allows you to export the Call Graph in a .png file. To export the Call Graph, right click anywhere in the Call Graph window and select "Export". A "Export Graph As" window will appear, type a file name for your graph and click Save.
Viewing Recursive Functions in Call Graphs