


 Рейтинг: 4.1/5.0 (1702 проголосовавших)
Категория: Windows: Сканеры, сниферы
Рассмотрим все эти этапы более подробно.
1. Выбор интерфейса для захвата пакетов.Для выбора сетевого адаптера прежде всего необходимо получить перечень всех сетевых устройств, установленных на компьютере. Для этого можно воспользоваться функцией GetAdaptersInfo. входящей в стандартную библиотеку Windows IPHlpAPI. dll. Ее прототип описан в одноименном заголовочном файле IPHlpAPI. h и выглядит следующим образом:
где pAdapterInfo – указатель на структуру _IP_ADAPTER_INFO ( модуль IPHlpAPI.h); pOutBufLen – указатель на тип unsigned long.
Структура _IP_ADAPTER_INFO определена в модуле IPHlpAPI.h следующим образом.
В ней нам потребуются следующие поля: Description – описание адаптера в виде, привычном для пользователя, и представляет собой указатель на тип char ; IpAddressList – список IP -адресов, закрепленных за интерфейсом, и соответствующих им сетевых масок. Представляет собой тип IP _ ADDR _ STRING ; Next – указатель на следующий элемент списка адаптеров.
Требуется описание еще одной структуры - IP_ADDR_STRING. Оно также приведено в модуле IPHlpAPI. h выглядит следующим образом:
В этой структуре нам также потребуются не все поля, а лишь два из них: IPAddress – содержит текущий IP -адрес интерфейса. Текущий потому, что интерфейсу может быть поставлено в соответствие несколько IP -адресов, которые могут меняться при динамическом назначении адреса. IpMask – содержит сетевую маску, соответствующую текущему адресу.
Доступ к значениям сетевой маски и адреса осуществляется через последовательное обращение ко вложенной структуре _IP_ADDR_STRING и затем к ее полю String типа char [16].
Замечание: при динамической загрузке библиотеки IPHlpAPI.dll необходимо подключать не модуль IPHlpAPI. а модули ipifcons.h и iptypes.h. Это обусловлено тем, что при объявлении в теле программы указателя на функцию GetAdaptersInfo возникает ошибка переопределения функции, объявленной в модуле IPHlpAPI . h .
Рассмотрим пример работы с данной функцией:
2. Создание сокета и привязка его к интерфейсуДля доступа к полям IP-заголовка необходимо создать RAW -сокет с типом протокола IPPROTO_IP и семейством протоколов PF_INET. Ниже рассмотрен пример создания такого RAW-сокета.
Замечание: Windows позволяет получить доступ и к заголовку протокола канального уровня. В этом случае необходимо использовать тип сокетов SOCK _ PACKET. семейство протоколов PF _ PACKET и протокол сетевого уровня ETH _ P _ ALL. объявленных в модуле WinBase .
После создания сокета его необходимо привязать к определенному интерфейсу, с которого сниффер будет захватывать пакеты:
Замечание: если требуется анализировать трафик на всех сетевых устройствах, то вместо адреса устройства необходимо указать INADDR _ ANY .
3. Перевод адаптера в неразборчивый режим работы Для перевода сетевой карты в неразборчивый режим работы используется функция ioctlsocket () из модуля Winsock 2. h. Функции передаются 3 параметра:В нашем случае параметром будет константа SIO_RCVALL. а параметром – флаг перевода адаптера в неразборчивый режим (1 – включить режим, 0 – выключить режим). Поясним все сказанное примером.
Замечание: после завершения работы сниффера рекомендуется остановить работу адаптера в неразборчивом режиме, установив значение flags = 0 и вызвав функцию ioctlsocket ();
4. Определение параметров фильтрации и захват пакетов. В рассматриваемом примере пакеты будут фильтроваться программным путем уже после их захвата. Собственно же захват осуществляется вызовом в бесконечном цикле функции recv (). Ее входные параметры:Параметр флаги используется для определения поведения функции независимо от выбранных опций сокета. Нам это не нужно, поэтому ставим 0.
Рассмотрим пример приема TCP -пакетов с установленными флагами SYN и ACK.
Вот, в принципе, сниффер готов. Полную версию рассмотренного снифера с исходным кодом можно скачать здесь (zip-архив 13 Kb). Остается только добавить, что использовался компилятор Borland C ++ Builder, поэтому при использовании другой среды разработки, возможно, придется заменить некоторые типы, например, USHORT и подобные (но это не факт).
О всех замеченных недостатках и ошибках, а также свои вопросы и пожелания пишите автору.


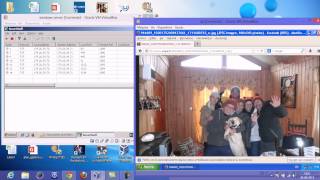


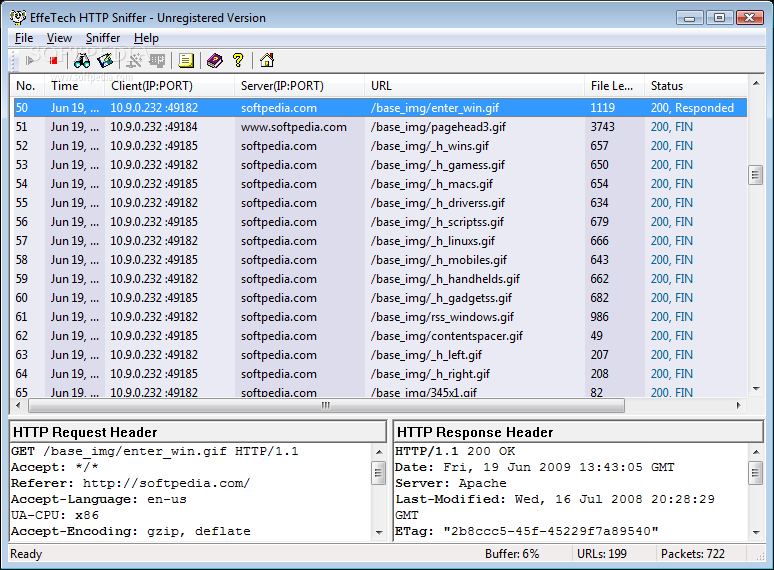
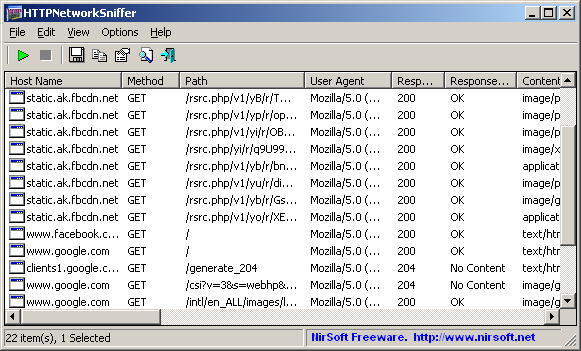
SmartSniff is a network monitoring utility that allows you to capture TCP/IP packets that pass through your network adapter, and view the captured data as sequence of conversations between clients and servers. You can view the TCP/IP conversations in Ascii mode (for text-based protocols, like HTTP, SMTP, POP3 and FTP.) or as hex dump. (for non-text base protocols, like DNS)
SmartSniff provides 3 methods for capturing TCP/IP packets.The new version of Microsoft Network Monitor (3.x) is available to download from Microsoft Web site .
Notice: If WinPcap is installed on your system, and you want to use the Microsoft Network Monitor Driver method, it's recommended to run SmartSniff with /NoCapDriver, because the Microsoft Network Monitor Driver may not work properly when WinPcap is loaded too.
Smartsniff can also capture data from other unsecured wireless networks, only on Windows 7/2008/Vista. For more information, read this Blog post: How to capture data and passwords of unsecured wireless networks with SniffPass and SmartSniff
Versions HistoryIn order to start using SmartSniff, simply copy the executable (smsniff.exe) to any folder you like, and run it (installation is not needed).
After running SmartSniff, select "Start Capture" from the File menu, or simply click the green play button in the toolbar. If it's the first time that you use SmartSniff, you'll be asked to select the capture method and the network adapter that you want to use. If WinPcap is installed on your computer, it's recommended to use this method to capture packets.
After selecting the capture method and your network adapter, click the 'OK' button to start capturing TCP/IP packets. while capturing packets, try to browse some Web sites, or retrieve new emails from your email software. After stopping the capture (by clicking the red stop button) SmartSniff displays the list of all TCP/IP conversations the it captured. When you select a specific conversation in the upper pane, the lower pane displays the TCP/IP streams of the selected client-server conversation.
If you want the save the captured packets for viewing them later, use "Save Packets Data To File" option from the File menu.
Display ModeSmartSniff provides 3 basic modes to display the captured data: Automatic, Ascii, and Hex Dump. On Automatic mode (the default), SmartSniff checks the first bytes of the data stream - If it contains characters lower than 0x20 (excluding CR, LF and tab characters), it displays the data in Hex mode. otherwise, it displays it in Ascii mode.
You can easily switch between display modes by selecting them from the menu, or by using F2 - F4 keys. Be aware that 'Hex Dump' mode is much slower than Ascii mode.
Starting from version 1.35, there is a new mode - 'URL List'. This mode only display the URL addresses list (http://. ) found in the captured packets.
Exporting the captured data SmartSniff allows you to easily export the captured data for using it in other applications:Your can also export the TCP/IP streams to text file, HTML file, or raw data file, by using "Export TCP/IP Streams" option. Displaying characters above ASCII 127
By default, characters above ASCII 127 are not displayed in the TCP/IP streams. You can enable high ASCII characters by using "Display Characters Above ASCII 127". When you use this option, the TCP/IP streams are displayed without colors. Be aware that when working in this mode, the loading process of the lower pane might be very slow.
The 'IP Country' columnsIn order to watch the countries of the local/remote IP addresses, you have to download the latest IP To Country file from here. You have the put the 'IpToCountry.csv' file in the same folder of smsniff.exe
You can also use the GeoLite City database. Simply download the GeoLite City in Binary / gzip (GeoLiteCity.dat.gz) and put it in the same folder of smsniff.exe
If you want to get faster loading process, extract the GeoLiteCity.dat from the GeoLiteCity.dat.gz and put it in the same folder of smsniff.exe
Capture and Display FiltersStarting from version 1.10, you can filter unwanted TCP/IP activity during the capture process (Capture Filter), or when displaying the captured TCP/IP data (Display Filter).
For both filter types, you can add one or more filter strings (separated by spaces or CRLF) in the following syntax:
[ include | exclude ]. [ local | remote | both ]. [ tcp | udp | tcpudp | icmp | all ]. [ IP Range | Ports Range ]
Here's some examples that demonstrate how to create a filter string:include:remote:tcp:80
include:remote:udp:53exclude:both:icmp
Starting from version 1.10, a new option was added to 'Advanced Options' section - 'Live Mode'. When SmartSniff capture packets in live mode, the TCP/IP conversations list is updated while capturing the packets, instead of updating it only after the capture is finished. Be aware that "Live Mode" requires more CPU resources than non-live mode. So if your computer is slow, or your have a very high traffic on your network, it's recommended to turn off this option.
Starting from version 1.20, you can also view the content of each TCP/IP conversation (in the lower pane) while capturing the packets. However, if the TCP/IP conversation is too large, you won't be able to watch the entire TCP/IP conversation until the capture is stopped.
The main header structure:
06 (8 Bytes) Packet time in Windows FILETIME format.
0E (6 Bytes) Source Mac Address.
Корпоративный сниффер эффективный инструмент, позволяющий проводить тотальный контроль и дифференцировать потоки внутренней, исходящей и входящей информации от пользователей. Такой инструмент можно адаптировать как для небольшой компании, так и крупной организации. Корпоративный сниффер не требует обширных знаний IT-технологий, он легок в установке и настройке. В течение неограниченного времени происходит сбор информационного поля, которое индексируется и анализируется. Корпоративный сниффер осуществляет перехват мгновенных сообщений, перехват передаваемых файлов, незашифрованных паролей. Помогает проводить проверку всех портов и вложенных пакетов. Корпоративный сниффер может быть установлен под разные основные среды (windows, vista).
Сниффер windows продвинутый анализатор сетевого трафика. Имеет возможность поддерживать развитую систему логов. Используя сниффер windows можно производить фильтрацию, например Hardware Filter ловит как все пакеты, так и с ограничениями. Большинство снифферов для windows работают без предварительной инсталляции, а также не требуют дополнительных драйверов. Сниффер windows производит динамическое распределение в зависимости от объема оперативной памяти, которое способствует освобождению оперативной памяти от лишнего объема ненужной информации. Сниффер windows ведет раздельный учет трафика при помощи IP фильтра. Можно установить лимиты, которые будут отключать выбранные программы и процессы при превышении трафика по сети. Благодаря поддержке протоколов TCP/IP, NetBEUI, Ethernet системный администратор анализирует пакеты данных, которые проходят через сеть.
Сниффер vista аналогичен снифферу под windows. Следовательно, основными функциями данного сниффера являются: поиск пакетов данных, сбор и фильтрация, построение отчетов, которые позволяют реконструировать данные. Сниффер vista способен перехватывать трафик интернета и локальной сети. Все данные проходят через сетевую карту или модем, затем в данной программе они декодируются. Сниффер vista нужен администраторам локальных сетей тем, кто хочет видеть картину сетевого трафика, проходящего через компьютер, профессионалам, которые работают в сфере разработки и обеспечения сетевой безопасности, программистам, которые создают программное обеспечение для сети.
Demonstrates how to intercept network traffic (IP packets) by putting a socket in promiscuous mode
IntroductionMany people have used a sniffer at some time. What is a sniffer? A sniffer is an application that catches all network traffic from or to computers attached to a network. Basically, what a sniffer really does is pay attention to all traffic by putting a network interface in the promiscuous mode state. Promiscuous mode puts a selected network interface to listening to all packets passing through it.
This article demonstrates how an application can configure a socket connection to pay attention to all network packets, instead of only those addressed to it. It shows how to grab protocols encapsulated by IP (Internet Protocol: network layer protocol), specifically, TCP and ICMP. IP encapsulates up to 100 different protocols. I advise you to take a look at the RFC 1700. as there is a complete list of all protocols that IP encapsulates.
Let Us Start to SniffThe demo project contains a single executable named lsniff.exe, which is a console application. The syntax is:
lsniff [TCP|ICMP]
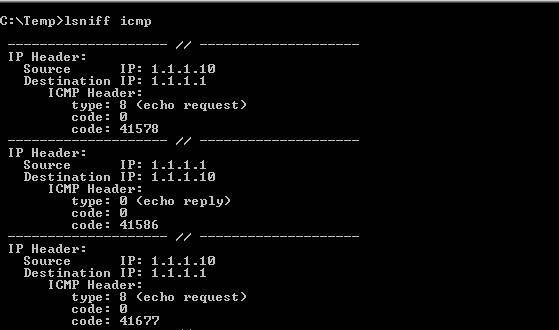
Figure 1: example of lsniff grabbing only ICMP packets
You also can redirect the output to a file: lsniff icmp >output.txt
Understanding the Source Codelsniff is a C/C++ application coded using Visual Studio 2005. It will compile in older compilers, too. It is really simple. In fact, the difficult part is to analyze the packets because you must know the packet structure that depends upon the protocol. Windows Socket API (WSA) offers the tools (functions) to create a simple sniffer.
It is worth mentioning that lsniff will run only if the you are logged on with administrative privileges. By reading lsniff_main.cpp, we will see the 4 necessary steps to start working in the promiscuous mode state:
Initialize Windows Sockets (line 107) .
Get a RAW socket (line 111). RAW is a special type of socket that gives you access to packet headers, not only the data.
Bind the socket to the interface you want to sniff (line 119-127) .
Set the socket to promiscuous mode (line 135) .
After all those 4 steps have been successfully performed, it is time to start reading the packets. Notice that you should provide a buffer big enough ( LS_MAX_PACKET_SIZE ) to the recv function. The first check made after a packet has been read is the IP version (line 161).
lsniff only parses IPv4 packets, not IPv6. Furthermore, the IP header is parsed to know what protocol is encapsulated. Notice that lsniff does not care about packet data, only packet headers. The rest of the code depends upon your knowledge about the protocol you want to parse. Of course, you can extend lsniff by adding more protocol-parsing routines. It is good practice to use a professional sniffer (like Ethereal) to help you to parse packets:
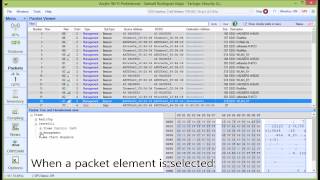
Figure 2: parsing packets
Enjoy. I hope this helps.
The granddaddy of packet-sniffing tools
Sniffer Portable Analysis Suite 3.5, from Sniffer Technologies, a Network Associates business, is a Windows-based fault analysis and performance management toolkit for network support staff in large organizations. The suite provides a complete set of network analysis tools, including Sniffer Pro LAN, Sniffer Pro WAN, and Sniffer Pro High Speed. Each product supports a different set of network interfaces. Together, the programs include support for Ethernet, Gigabit Ethernet, asynchronous transfer mode (ATM), and WAN links and can decode a variety of protocols. Organizations that have 10/100 Ethernet and Token-Ring networks might consider Sniffer Basic, which is a more affordable package. However, Sniffer Basic doesn't include Sniffer Technologies' Expert analysis feature, which diagnoses network performance problems. Sniffer Technologies included Sniffer Reporter 3.5 with my review package; Sniffer Reporter is available at extra cost and adds graphical reporting capabilities for 10/100 Ethernet and Token-Ring data.
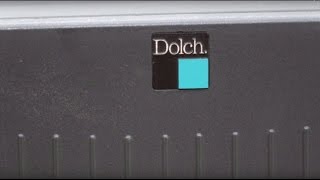
Installing the Sniffer Portable Analysis Suite is simple. I launched setup.exe, confirmed the default installation directory, and rebooted the system. When you install Sniffer, the program detects network cards installed on the system and lets you select a card to monitor network traffic. The suite will work with any network card that you can place in promiscuous mode. However, if you want to fully support the suite's features, you need to use a network card that Network Associates supports with an enhanced driver. In addition, Gigabit Ethernet support requires that you run the software on a Dolch PAC 64 or Dolch PAC 65 portable computer.
The suite's documentation includes an Installation Guide, a Getting Started Guide, and online Help. The documentation materials are clear and useful for beginning users. However, I wanted more details about how to implement features and create and use filters and triggers, and about how the software evaluates filter criteria (e.g. which elements are ANDs, which are ORs, and what precedent order exists when the software evaluates an expression). More detailed information might save network analysts hours of experimentation. The installation guide refers users to several other manuals that can help you use Portable Analysis Suite with additional hardware components, including the Switch Expert Connection and Configuration Guide and manuals for ATM, WAN, and a Fast Ethernet full-duplex pod.
Monitor Mode
Sniffer has two primary operating modes: Monitor mode and Capture mode. When you start Sniffer, the program enters the default Monitor mode and displays the Dashboard Monitor application and an inactive Capture dashboard. The program includes several monitoring applications, each of which gives you a different view of your network's traffic. The statistics that each monitoring application provides depend on which physical interface you monitor. LAN adapters, ATM adapters, and WAN adapters will each provide a different set of metrics.
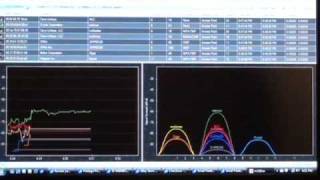
Screen 1 shows example displays from the Matrix, Protocol Distribution, and Host Table monitor applications. You can use display filters to limit the information that these monitor applications display. You can use a variety of criteria—including network address, network protocol, and packet contents—to include or discard packets. Monitor filters let you prioritize your problems and avoid wasting time reviewing network packets that don't relate to problems you're working on.
Monitor Applications
Before you create a performance management program, you need to know what performance is normal for your application. Therefore, I began testing by examining the History Samples monitor application, which you can use to easily collect baseline statistics. The application collects as many as 10 samples simultaneously and lets you choose from a variety of network metrics. You can include basic metrics (such as packets per second, segment utilization, error rates) and specific metrics (such as the occurrence rates of specific error types—e.g. runts and collisions—and the occurrence rates of packets in a particular size range). For each sample you collect, you specify sampling frequency and upper and lower sample thresholds. Sniffer will record as many as 3600 points for each sample before data collection automatically turns off. You can export baseline samples to other applications in comma-separated, tab-delimited, or fixed-format text files.
Using the History Samples application is easy. An icon for each metric that you can sample appears in the application interface. To sample a metric, you simply click the appropriate icon. I right-clicked in the History Samples window, selected New Multiple Sample from the context menu, and created a 10-metric sample after clicking an icon to start sampling. When sampling starts, the application displays data graphically and gives you the option to save the data when you close the window.
After you establish baseline information, you can use the Host Table Monitor application to display realtime statistics for each network node that has traffic visible to Sniffer. When I started the application, it quickly displayed a list of network nodes that grew as the application detected network traffic from additional systems. To display overall traffic statistics for a network node, you select Outline view; to break down node traffic by protocol type, you select Detail view. You can also display summary views for either IP traffic or IPX-only traffic. Other toolbar icons display Top Talkers (network nodes that generate the most traffic) in either bar- or pie-chart format. Another context menu item lets you display data in tables so that you can export the data to other applications. You can select a column heading to sort table data, which lets you quickly see which network node is generating the most activity.
To use the Host Table Monitor application, I selected a network node, then clicked Capture to capture packets going to and from that node. The standard Expert display (which I describe shortly) appeared. When I selected Stop and Display from the Capture menu, additional tabs appeared, giving me several views of the captured data. The application let me save the captured packets to a capture file to review later.
Next, I tested the Matrix Monitor application. To access this application, I selected Matrix monitor from the Monitor menu. Like the Host Table Monitor application, the Matrix Monitor application displays realtime statistics for each pair of network nodes that are in communication. The Matrix Monitor application offers several views of paired-node traffic statistics. The Map view graphically represents the node pairs, the Outline view shows packet and byte counts in a tabular format, and the Detail view breaks down the conversation pairs by protocol. You can also display a Top Talkers chart. You can export the table view and capture highlighted node-pair packets within the Matrix Monitor application. I appreciated having the ability to limit the display to the IP or IPX protocols and to select any column heading in a tabular display to sort columns.
After I reviewed the Matrix Monitor application's features, I used the Protocol Distribution Monitor application to quickly view the protocols that the monitored network segment was using and each protocol's relative volumes of network traffic on the segment. In addition to the network protocols that Sniffer recognizes, the Protocol Distribution Monitor IP and IPX tabs provide traffic statistics for common IP (port level) applications and for IPX protocols such as SPX, Service Advertising Protocol (SAP), and NetBIOS. I selected Pause to freeze the screen, then selected Export to save a Protocol Distribution data sample. The application let me save the data as a space-delimited, tab-delimited, or comma-delimited file to use with a database, spreadsheet, or other reporting application.
The Dashboard Monitor application, which features three dashboard-style dials, is the default application that displayed when I started Sniffer. This application displays overall network activity, including Packets per Second, Segment Utilization Percentage, and Errors per Second. In this application, the Detail view displays a running total for all available metrics, and the Export function saves the running total for all metrics to one of the three file formats that Sniffer supports.
Sniffer Technologies' documentation also describes the Global Statistics Monitor application (which breaks down network traffic by packet size and bandwidth utilization and displays the data in either a bar or pie chart) and several other monitor applications that are relevant to only a few hardware environments. The Smart Screens application displays counters for ATM cell and frame types. The Physical Layer Statistics window, relevant only to ATM networks, displays various metrics, depending on the transmission media and connection type. The Switch Statistics window is available when Sniffer is connected to a Cisco Catalyst 5000 switch and displays statistics for the physical port module or Virtual LAN (VLAN) that you define in the switch. I hope Network Associates extends support for other switches in future versions of Sniffer.
Sniffer maintains an Alarm Log for events that the Sniffer Expert, the Dashboard Monitor application, and the Switch Statistics application detect. The Dashboard adds events to the Sniffer Alarm Log whenever one of the available metrics exceeds a threshold value that you enter on the Threshold tab on the Dashboard Properties page. The Sniffer Expert records alarms for symptoms that the software detects and diagnoses it makes. You can set each alarm to one of five severity levels. You can configure as many as four Notification Actions for each severity level. These actions can sound an audible alarm, use an available SMTP server to send an email message, call a pager, or run a VBScript routine. You can enable and disable alarms according to a weekly schedule so you won't be disturbed at noncrucial times.
Capture Mode
Capture Mode complements Monitor Mode by capturing full or partial network packets to a capture buffer file. Capture Mode includes Sniffer's realtime Expert analysis feature, which detects symptoms of network problems and diagnoses underlying problems. When capturing is active, only the Expert analysis summary view of the captured packets is available. After you stop and display data that Sniffer captures, you can view individual packets in the Decode window. Matrix, Host Table, and Protocol Distribution views are also available; these views display summaries of data that are similar to those that the corresponding Monitor application creates.
Capture mode includes two powerful features: filters and triggers. Capture filters let you ignore packets that you can't use and highlight the packets that you want. Capture filters screen packets either according to simple address or protocol criteria or according to complex Boolean expressions that examine packet parts that you define. A trigger automatically starts a capture session when the program recognizes a predefined criterion (e.g. time of day, an alarm, packet characteristics). You can set packet capture to continue for a specific period of time or to stop at a specific time of day or when the program recognizes a second criterion.
When, after a network reconfiguration, the connection between my remote mail server and one of my workstations failed, I created a filter that would capture all traffic to and from the workstation and ignore other traffic on the network. I used this filter to define both the start criteria and capture criteria for a trigger. I didn't define stop criteria, which meant I could stop the capture manually when I was ready to look at the captured data. I selected OK on the Trigger Setup screen to activate the trigger (you can activate only one trigger at a time). Then, I started my mail client at the workstation. The resulting network traffic started the capture. After I reproduced the failure, I stopped and displayed the data I'd captured. The data revealed that, after trying to connect using the mail server's NetBIOS name, Microsoft Outlook appended the default IP domain name and attempted to connect again. The connection failed again. I used the remote mail server's proper DNS name in the mail client to correct the problem and speedily reestablished the connection.
Expert analysis. When you select Start from the Capture menu, the Expert window appears. This window lets you view Sniffer's summary and analysis of the packet stream the software is capturing. A selection pane at the left side of the window lets you select Objects, Symptoms, or Diagnoses to display in the right-hand pane. Objects reveal the activity of Network Nodes at different network layers. Symptoms are alerts that Sniffer generates when a metric passes a predefined threshold. Diagnoses are Sniffer's assessment of the underlying problem that one or more Symptoms indicates.
The right pane also lets you display more detailed network activity information sorted by network layer. Sniffer provides Application, Session, Connection, Station, and Data Link Control (DLC) layer information. After Sniffer monitored part of the Lab network for a few minutes, I displayed Objects. Sniffer reported several kinds of activity: several Server Message Block (SMB) conversations at the Application layer; WINS, IP, NetBIOS, and NETBEUI conversations at the Session layer; TCP and UDP traffic at the Connection layer; packet counts by protocol at the Station layer; and Ethernet frames by vendor-translated media access control (MAC) address at the DLC layer. A Global layer shows summary statistics. A Route layer decodes and displays route information from Routing Information Protocol (RIP) packets. A Subnet layer displays information about network subnet addresses that the program detects.
When I selected Symptoms to display during my test, the right pane showed symptom reports at the Application, Connection, and Station layers. The Application symptoms were reports of systems that aren't in the Domain list. The Connection symptoms were all related to timing. The only Station Symptom that Sniffer reported was Time-to-live exceeded in transit. All these symptoms are minor, and Sniffer reported no Diagnoses for these symptoms.
The Expert analysis feature promises to reduce the technical skill levels that network support technicians need to use Sniffer. Although I can't measure how useful the Expert analysis feature will be for a specific organization, any tool that aids identification and interpretation of network symptoms will be helpful to all but the most experienced network analysts.
Post-capture analysis. When you stop and display captured data or load a capture file that you've saved, the Expert window renames itself as a Sniffer window, and several tabs appear at the bottom of the pane. Screen 2. page 146, shows an example of a post-capture window. From the Expert tab, you can see how many Diagnoses, Symptoms, and Objects exist at each protocol layer. If you highlight a protocol layer, the number of packets of each protocol type will display in the lower left corner of the pane. The Objects tab (which is to the right of the Expert-tab view) gives details about each highlighted object. The Statistics tab displays summary information for a capture session and includes packet and byte counts (both total and organized by protocol), average network utilization, and broadcast traffic statistics. The Host Table, Matrix, and Protocol Dist. tabs provide information similar to the information that the Monitor application provides. The Decode tab is the entry point for packet protocol decode displays, which will be familiar to anyone who has used Windows NT Network Monitor or other packet-sniffing programs.
The Decode window has three stacked panes: The upper pane lists a one-line summary of each frame, the middle pane displays decoded data, and the bottom pane displays captured frames in hexadecimal notation. Sniffer also saves Status and Expert records with the capture. Sniffer's post-capture tools let you set packet display filters, select a set of specific frames for display, and search for frames containing text or data you specify.
Additional Sniffer Features
You can save the names and addresses of network nodes you discover during monitoring and capturing in the Sniffer Address Book. You can access this network address information by node name. Sniffer includes a set of IP network tools, including Ping, Trace Route, DNS Lookup, Finger, and Whois. Sniffer also lets you configure operations to suit your needs. For example, you can choose to display or suppress specific protocols, set the color Sniffer uses to display a protocol, and set IP port names.
Overall, the Portable Analysis Suite's user interface (UI) is easy to understand and use. The address book, which lets network device names display in place of network addresses on various displays, is easy to create when you use the Display Discovered Addresses menu item and the Update Address Book option. After you create a Sniffer address book, Sniffer's other displays are more user-friendly because they display a computer's name instead of its address.
Sniffer Technologies can improve a few aspects of the suite's usability. For example, when you define filters, Sniffer maintains separate sets for Display filters and Capture filters. The only difference between the two filters is the presence of buffer-related parameters (which have default values) in the Capture filter. Sniffer Technologies might simplify the program by letting users use one set of filter definitions as either Display or Capture filters. You can set up another common filter criterion—TCP or UDP port numbers—by selecting one of a predefined number of ports. However, if the port you want isn't on the list, your only option is to create a custom data pattern and compare specific offsets within the packet with specific hex values. This task requires both technical knowledge and impeccable typing skills. However, a handy shortcut for creating Data Pattern filters exists. When you view a packet on Capture's Decode tab, you can select Define Filter from the Capture menu and select portions of the packet to easily create a custom data pattern, as Screen 3 shows. Using a TCP or UDP port number as a filter criterion is common, and I'm surprised that a simple way to key in port numbers directly doesn't exist. You must also use a data pattern to construct other common filtering criteria. Although capturing data to and from specific systems is easy, filtering to capture all traffic to or from all stations on an IP subnet requires data-pattern filtering. An ability to filter on a network address and subnet mask would be useful. Changing Boolean logic in a data pattern is a cumbersome process that requires deleting and adding lines. A drag-and-drop feature would simplify these steps. The UI for defining filters is easy to use for simple filters, but the interface is cumbersome when you need to use Boolean logic or an undefined port.
Support for additional switches would also enhance this software. Although I wasn't able to test this feature, the ability to connect to a Cisco 5000 switch and monitor a specific VLAN is important, especially because fully switched networks have become standard. Sniffer Technologies plans to add support for additional switches in version 4.0.
Sniffer Portable Analysis Suite is a feature-rich network monitoring and protocol-analysis application that will attract enterprises that need to support a broad range of LANs or large WANs. Sniffer Basic will be attractive to small organizations that need a more sophisticated network monitoring tool than Microsoft Systems Management Server (SMS) Network Monitor. The suite is valuable both for routine network monitoring and for troubleshooting specific network problems.
Sniffer Portable Analysis Suite 3.5
Sniffer Technologies, a Network Associates business * 800-764-3337